- Hitting the Bid
- Posts
- The 9,900 S&P forecast that doesn’t add up
The 9,900 S&P forecast that doesn’t add up
Bank of America says the S&P 500 could hit 9,914 by 2027. I ran the math and here’s why the odds say otherwise.
Jeff Sanchez
September 09, 2025 • Est. Reading Time: 8 minutes

Welcome back to Hitting the Bid Weekly!
On deck this week…
Weekly Market Recap: S&P 500 hits another high while traders wait on the Fed
Quick inflation check before next week’s rate decision
Bonds signal a shift in focus
When projections don’t pass the sniff test
Around the Market
Stocks push higher, but the real test comes next week.
The S&P 500 (via SPY) hit another all-time high on Friday, reaching $652.21 before selling off into the weekend. For the week, SPY gained about 0.6% (congrats to team “Up”) with strong buying after bottoming at $634.92 last Tuesday. The last three Fridays have brought plenty of movement tied to macro events and data releases. While we’ll get a couple of inflation reports this week, many traders may wait until next Wednesday’s FOMC meeting before making bigger bets. Until then, it feels like the market is catching its breath before the next big move.
Where do you think the S&P 500 will be next week? |

Daily chart of SPY over 1Y time interval
Other key market moves last week:
Volatility (VIX): Slightly lower, down 0.15 to 15.11
Gold: Continued its rally, up $214 to $3,677
Bonds: Very strong, up 2.8% to 117.4
US dollar (DXY): Strong on Tuesday but faded through the week, down 0.32 to 97.45
Crude oil: Couldn’t sustain momentum, down about $1.75 to $62.26
Bitcoin: Mostly flat, up around $1,000 to $112,100
The Week Ahead
Economic Calendar
Producer Price Index PPI (Wed 9/10 8:30a ET)
Consumer Price Index CPI (Thu 9/11 8:30a ET)
Michigan Consumer Sentiment (Fri 9/12 10:00a ET)
Consumer Retail Sales (Tue 9/16 8:30a ET)
Notable Earnings
Not an exhaustive list — just a few I’m watching closely for potential market impact.
On My Radar
Traders weigh jobs data over inflation as rate cuts loom
Last week, I was ruminating on what has to give as we look at a potential cut in the Fed Funds rate despite sticky inflation. We may now have our answer. Inflation hasn’t gone away, but after Friday’s August NFP report showed about 53K fewer jobs added than expected, along with downward revisions of 21K for June and July, bond traders appear to be looking past inflation. They seem to be signaling that lower rates may be needed to keep the labor market on steady ground.
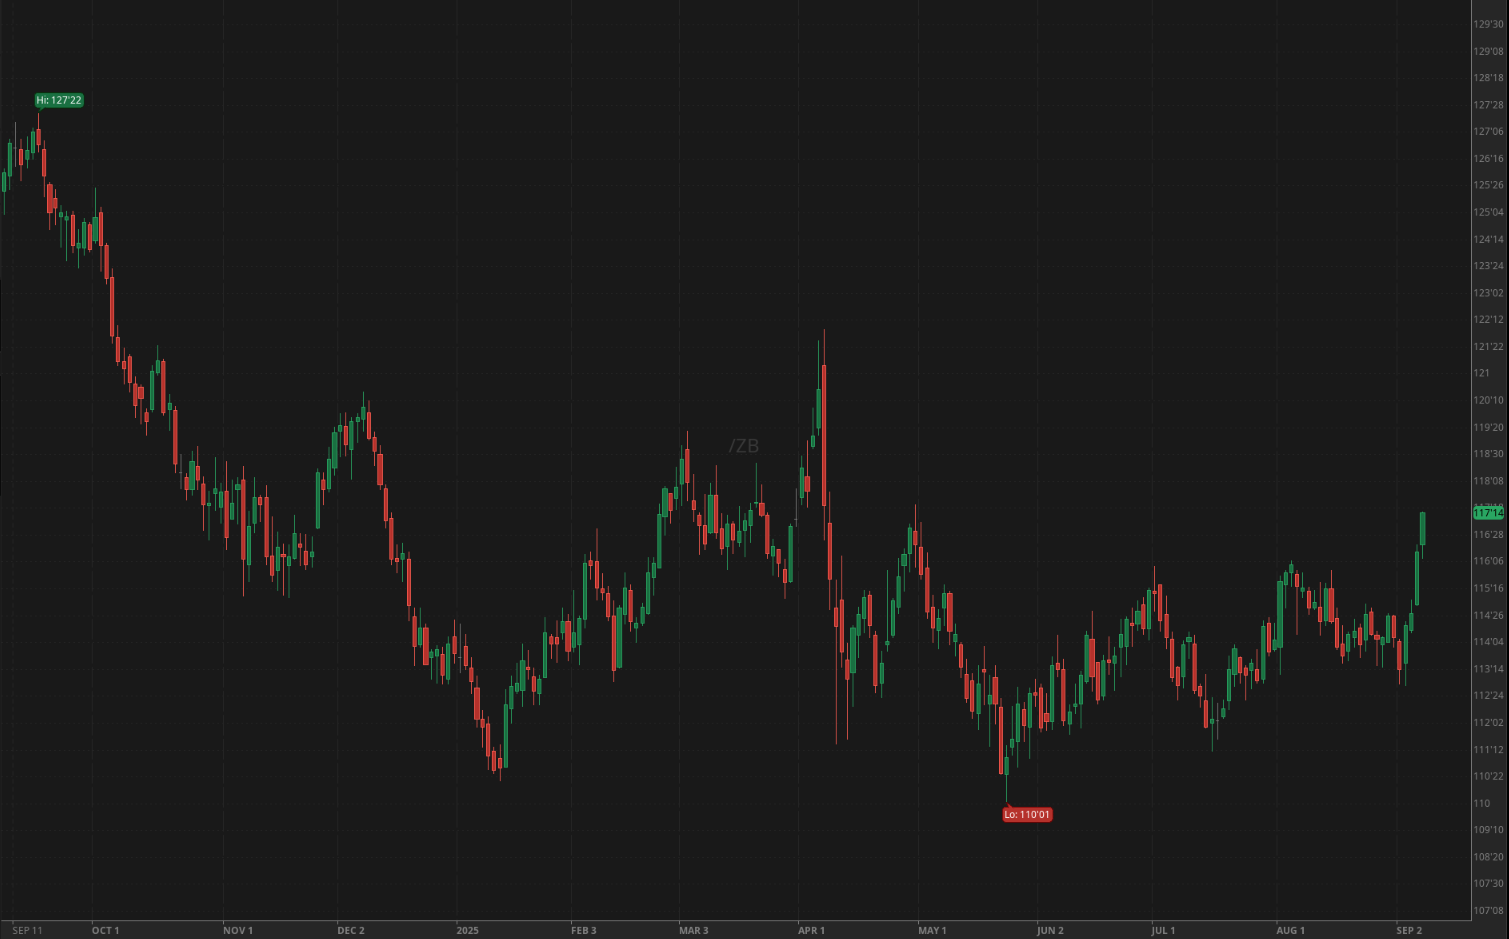
Daily chart of ZB futures (continuous contract) over 1Y time interval
Following the NFP release, bonds across all durations rallied, pushing yields lower across the curve. The most notable moves came at the long end, represented by ZB futures and TLT. With PPI and CPI inflation reports on deck this week, I’ll be watching and waiting to see how bonds and yields react. If inflation remains elevated and bonds don’t sell off, it would suggest traders are continuing to prioritize labor market stability over inflation. It could be the clearest signal yet that the market’s focus is shifting.
What’s Top of Mind
Using probabilities to sanity-check bold market calls
At this point, if you’re reading this newsletter, it’s clear I like to use math and probabilities to test whether something makes sense. Last week, I came across a piece of news that didn’t quite pass the sniff test. According to Bank of America, the S&P 500 could hit 9,914 in September 2027 (per Axios). With the S&P 500 currently around 6,500 (via SPX), that would imply a gain of roughly 52%.
I couldn’t track down the specific Bank of America report behind this claim, but being the nerd I am, I asked myself: What’s the probability of actually getting to 9,900 by the end of 2027? How does the math check out?
To find out the 1 standard deviation expected move of a stock, I use the formula simplified by the Tastylive researchers provided here:
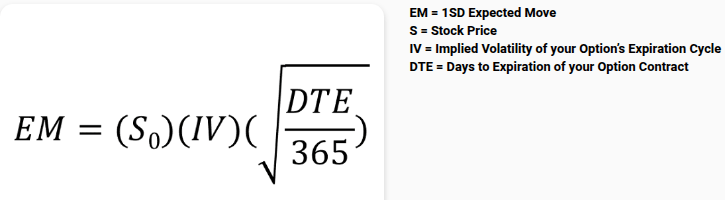
Right now, the 1SD expected move over two years for the S&P 500 is ±$1,985, which gives a range of $4,515 to $8,485. In other words, there’s a 68% probability the S&P 500 will fall within this range two years from now. Looking only at the upside, assuming a normal distribution, that leaves a 16% chance ( [100%-68%] / 2) the index is above $8,485.
If your eyes are glazing over, here’s the shortcut: this math is already baked into the options chain. Looking at the June 2027 expiration (September contracts aren’t listed yet), a strike close to 9,915 is the 9,800 call. The probability of it expiring in the money (meaning the S&P 500 is >9800 by June 17, 2027) is about 2%. That doesn’t perfectly align with September 2027 since there are three extra months of trading, but we’re in the ballpark. It’s still very unlikely to get there.
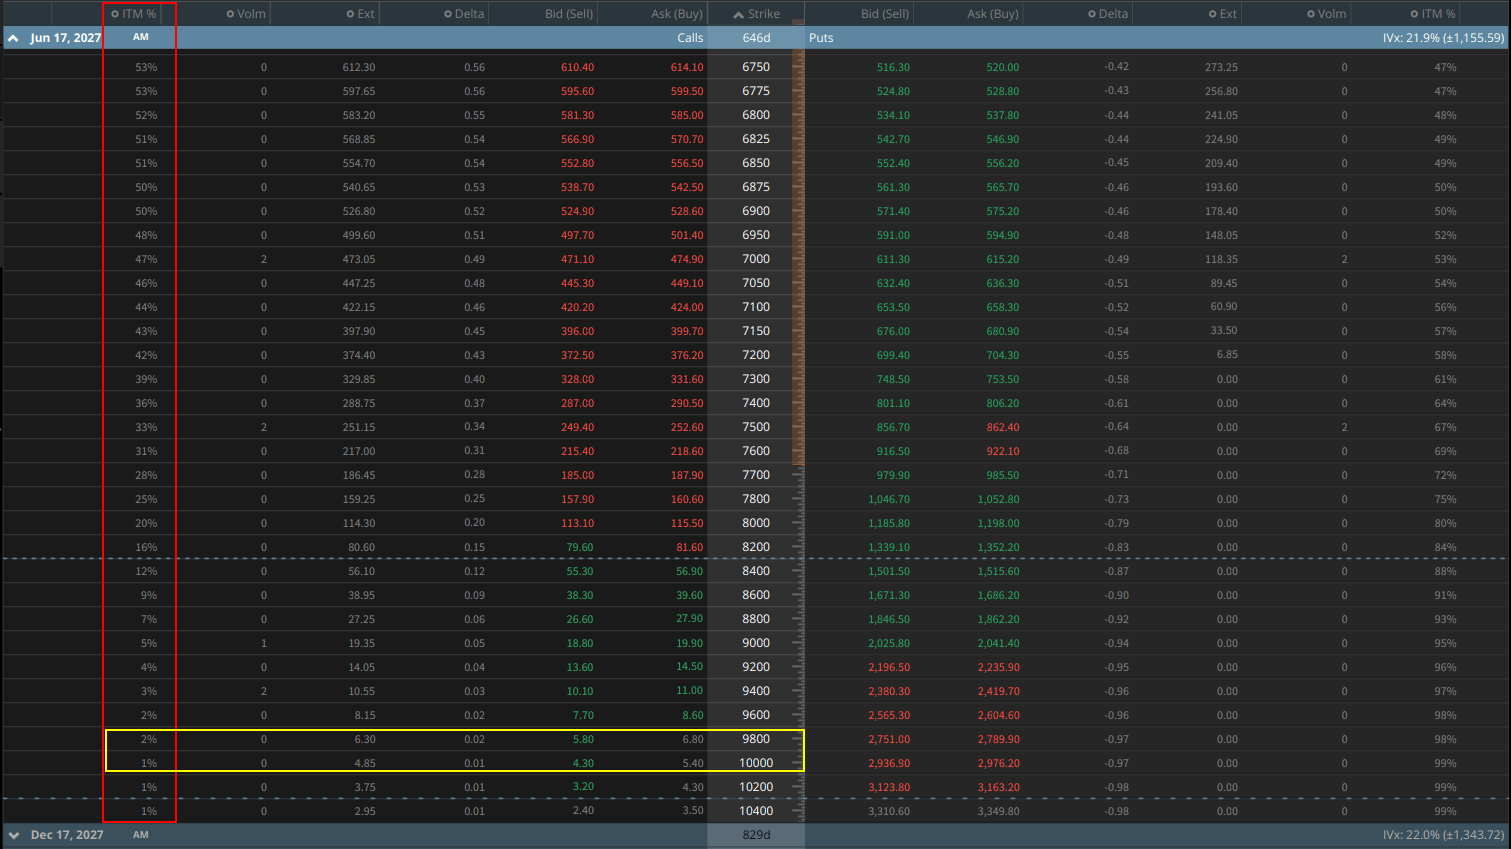
SPX (S&P 500) option chain showing the June 17, 2027 expiration
The takeaway isn’t that you should start running standard deviation calculations or pulling up options chains every time an analyst makes a bold call (though have at it if that’s what you want to do). And who knows, 2% isn’t zero so there’s still a chance it gets there. The point here is that you don’t have to take projections like this at face value. Market-based tools can help you assign probabilities to outcomes and put things in context. They aren’t perfect, but I believe they’re the best we have given the current information. A timely example is the CME FedWatch tool, which uses market pricing to show probabilities of future Fed Funds rate changes when FOMC minutes are released. It’s what I use to understand the most likely outcome of each meeting instead of listening to financial media. At the end of the day, big projections make headlines. But probabilities tell the real story.
Thanks for reading this week!
If something sparked your interest — or you’ve got a hot take of your own — hit reply or find me at [email protected]. I read every email.
P.S. Want to see more of my trades? Subscribe to my YouTube channel.
Like what you’re reading?
Forward this to a friend or share the newsletter link to help grow the HtB community.

Hitting the Bid content is for informational and entertainment purposes only. The information contained is not, nor is it intended to be, trading or investment advice or a recommendation of any security, futures contract, digital asset or alike. I may hold a position in the trading vehicles discussed. Trading and investing contains risk. All investors should evaluate their own risk tolerance, financial situation, and investment duration before entering any trade or investment.